
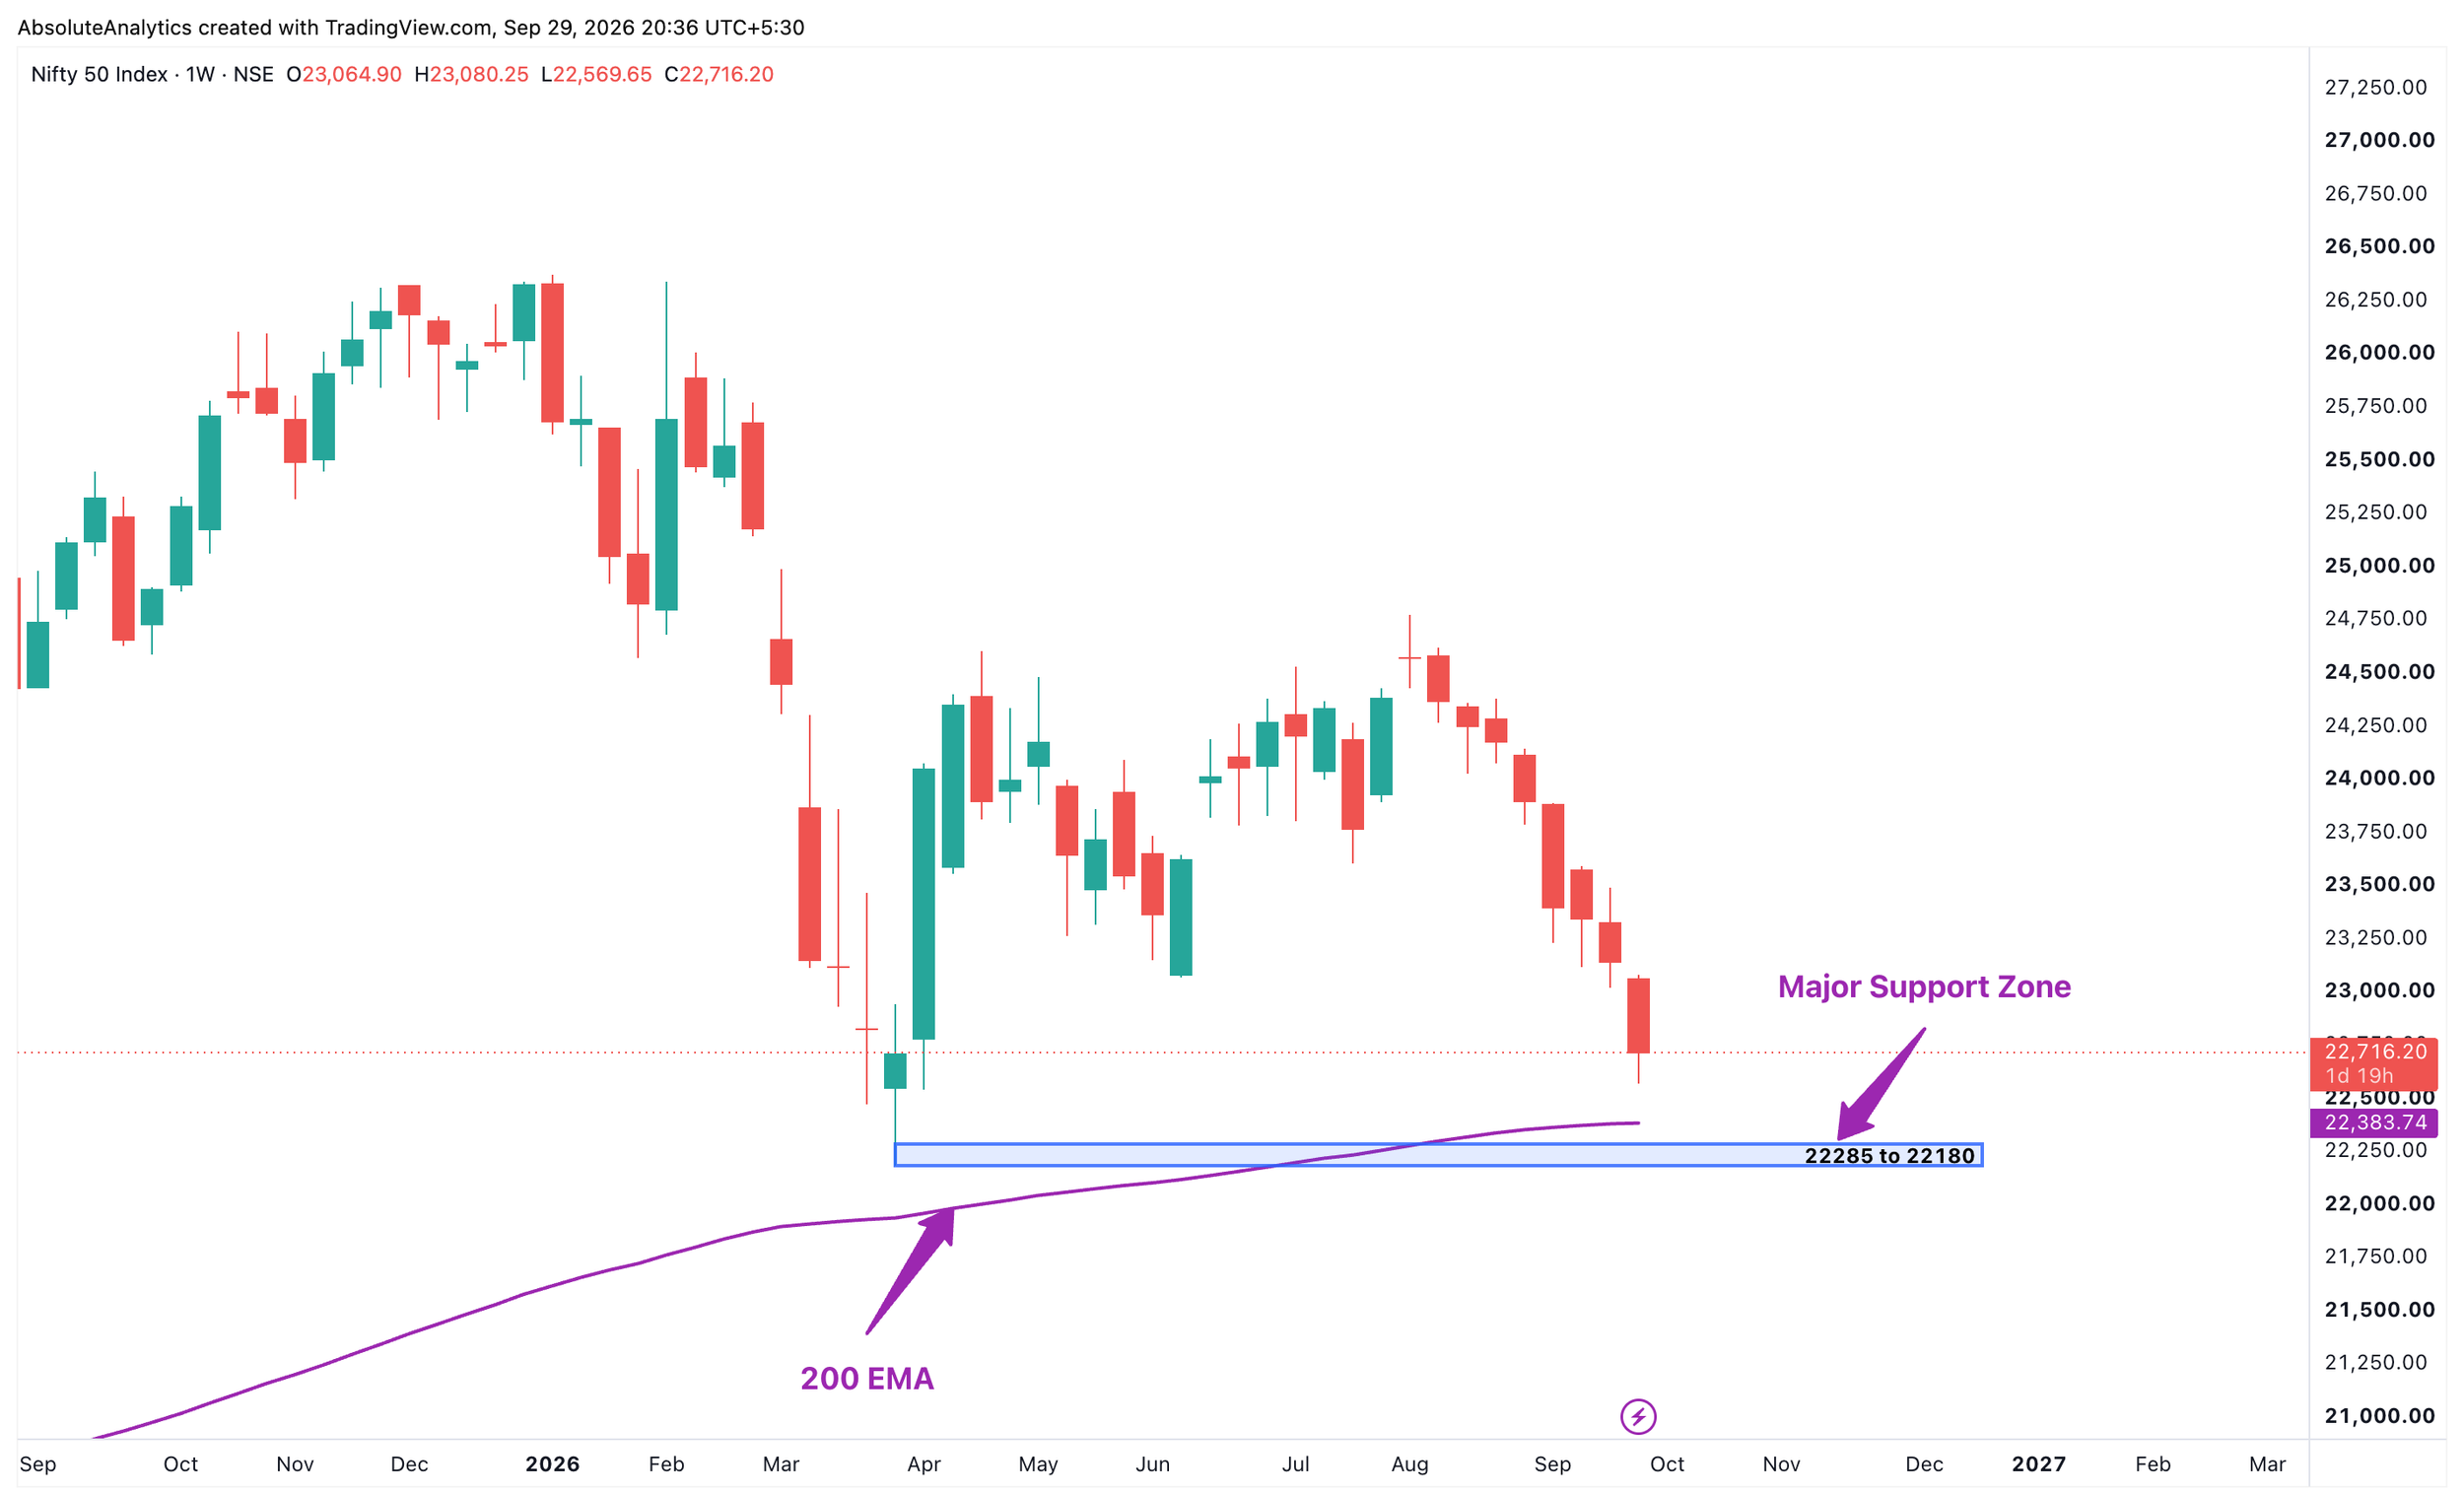
The benchmark NSE Nifty 50 recently closed lower for its seventh consecutive week, ending near 22,569 as the low as on 29th Sept,2026, and its only Tuesday!
Marking its longest uninterrupted slide since the chaotic COVID-19 crash of February–April 2020, this milestone has sparked widespread headlines and drawn direct comparisons to 2020.
However, treating today’s market condition as a simple sequel to 2020 is a fundamental misdiagnosis. Below is an in-depth, source-backed breakdown reading between the lines of both crashes, detailing how the 2020 market staged its recovery and mapping the fundamental and technical triggers required to initiate a durable reversal today.
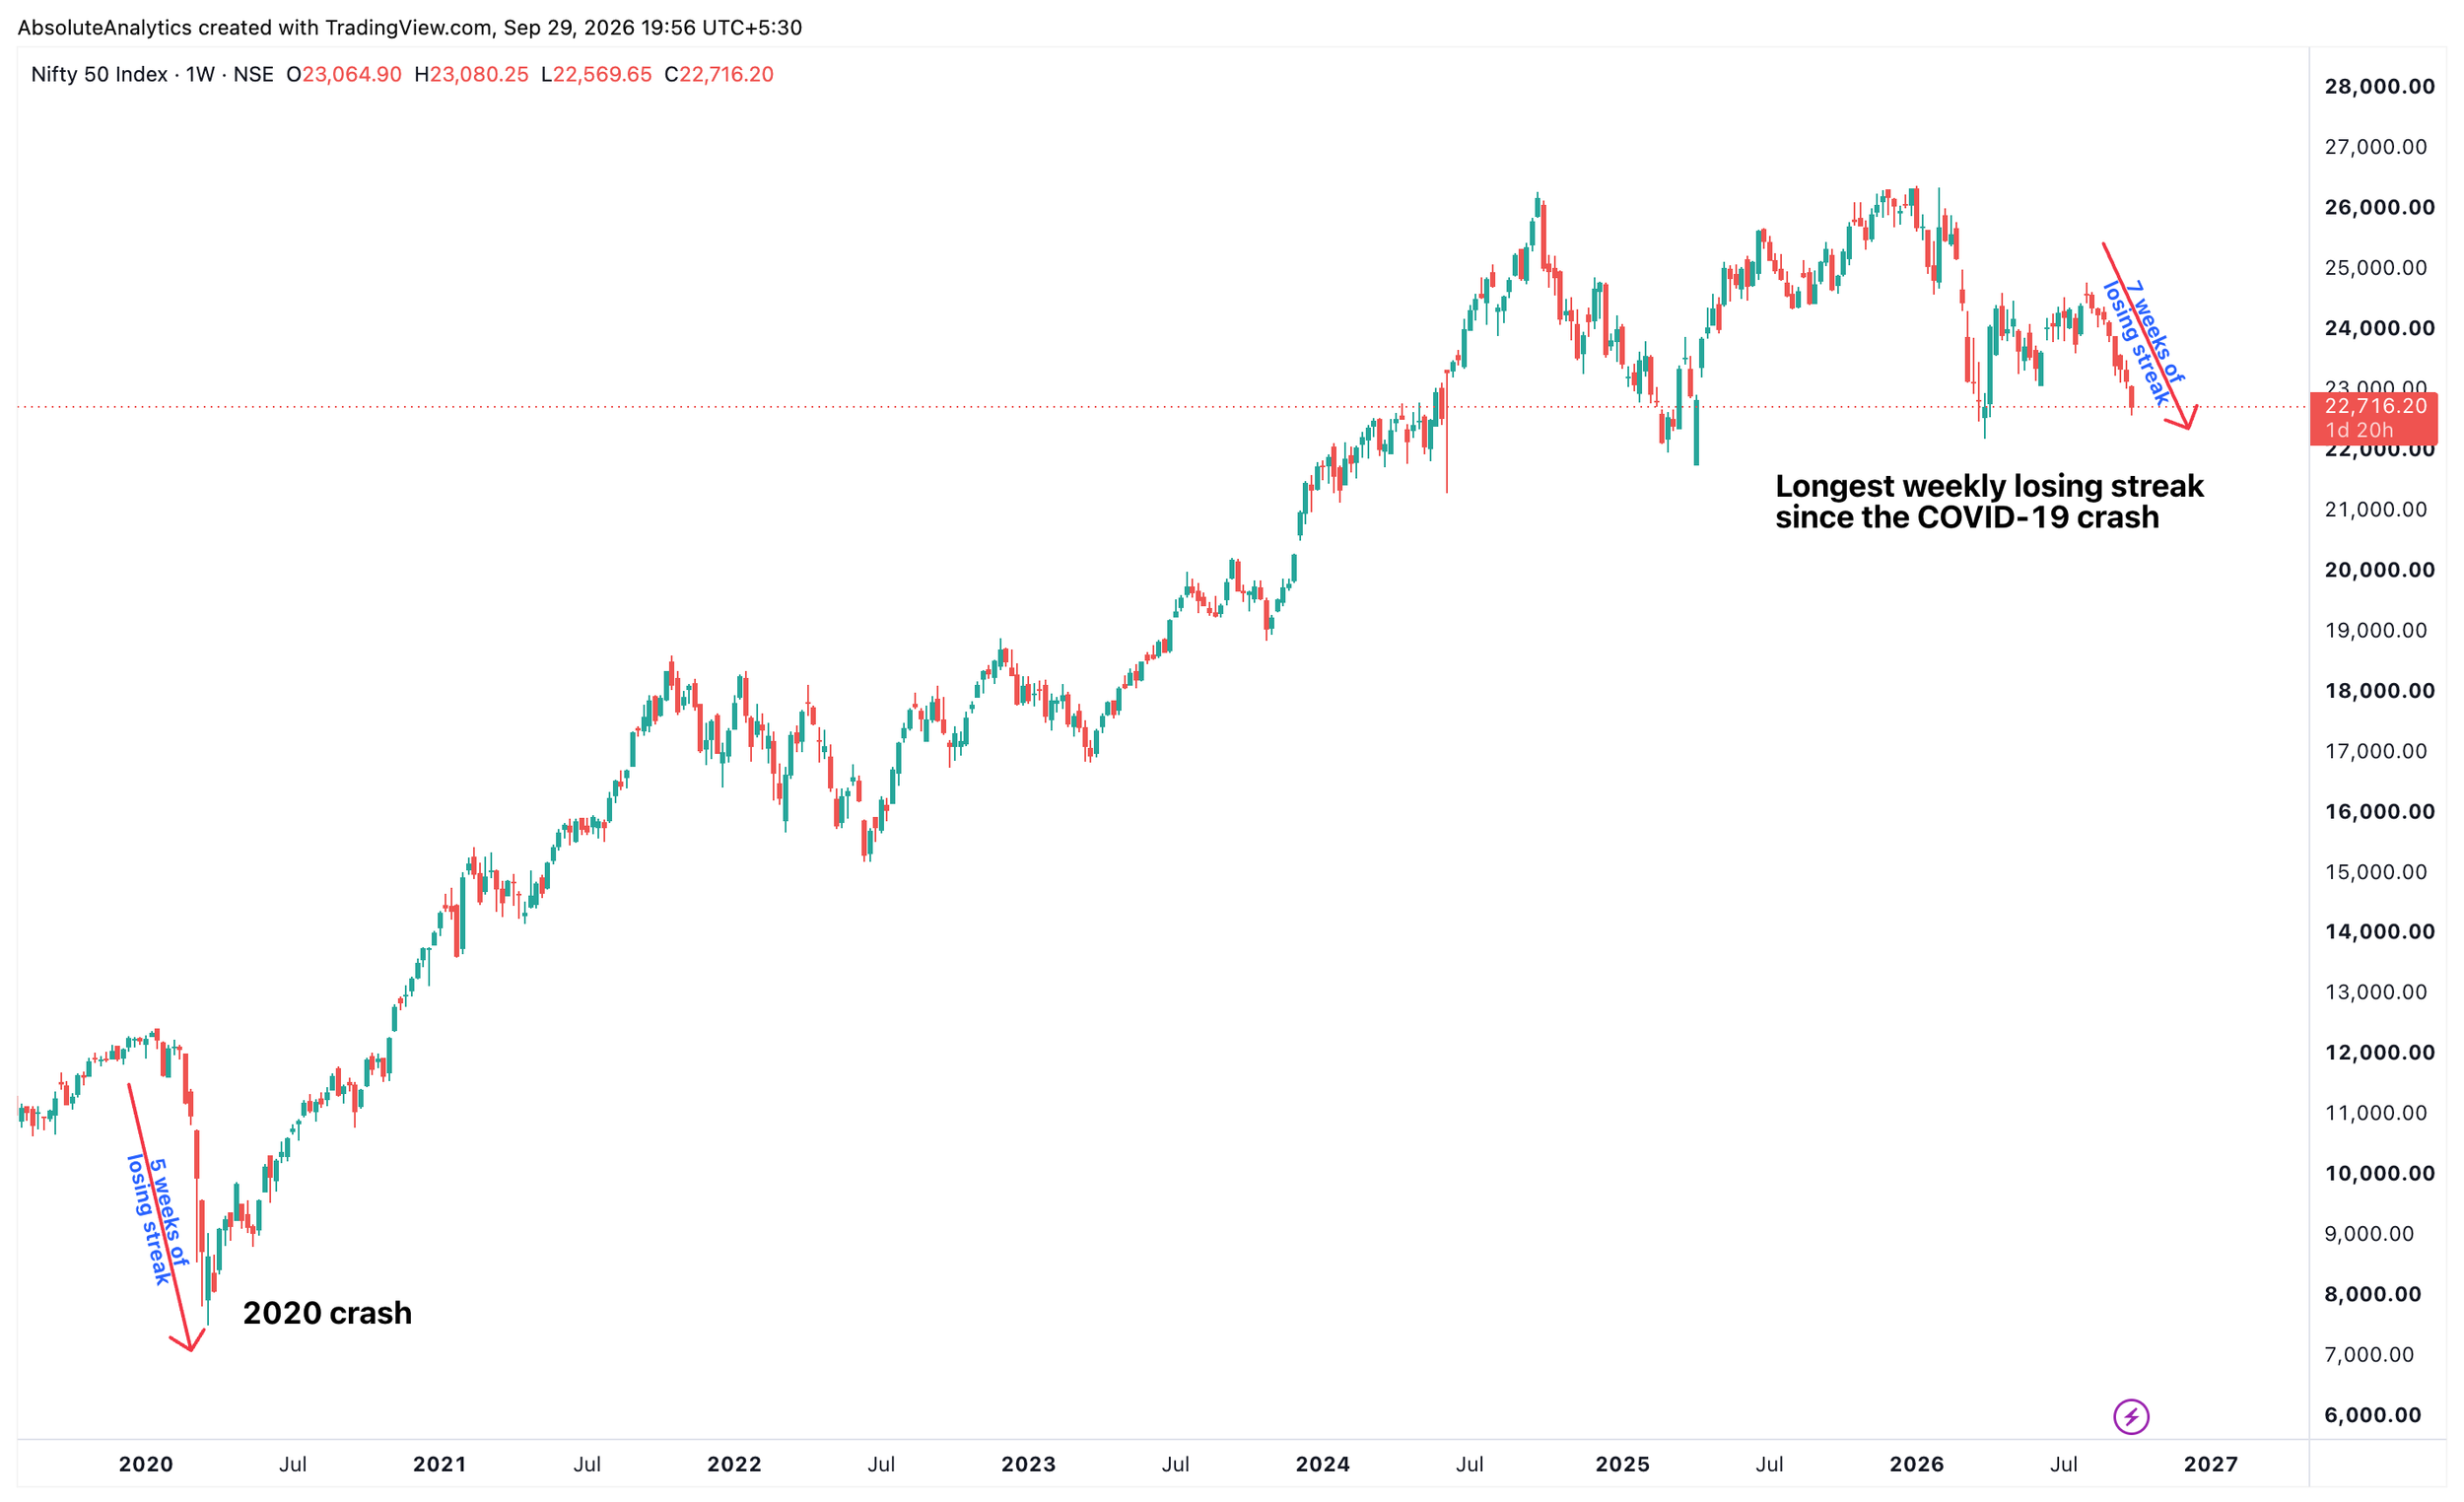
How Do Both Crashes Differ?
While both downturns share a 7-week duration, their underlying market mechanics, drivers, and institutional flows diverge significantly. Summarising the key differences in the characteristics of both crashes:
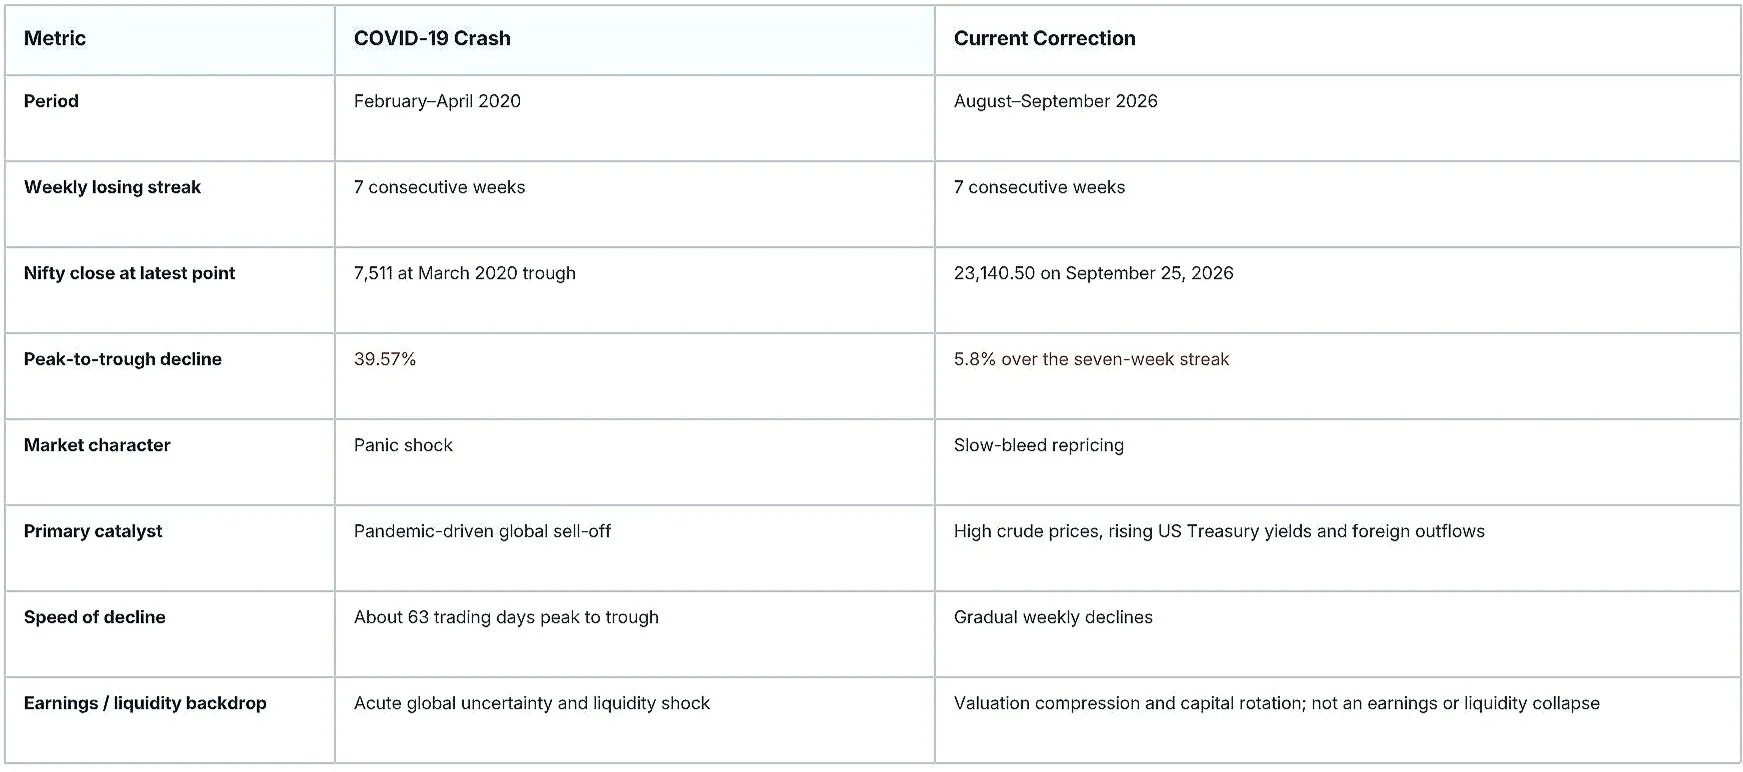
The Difference:
Panic Shock vs. Slow Bleed:
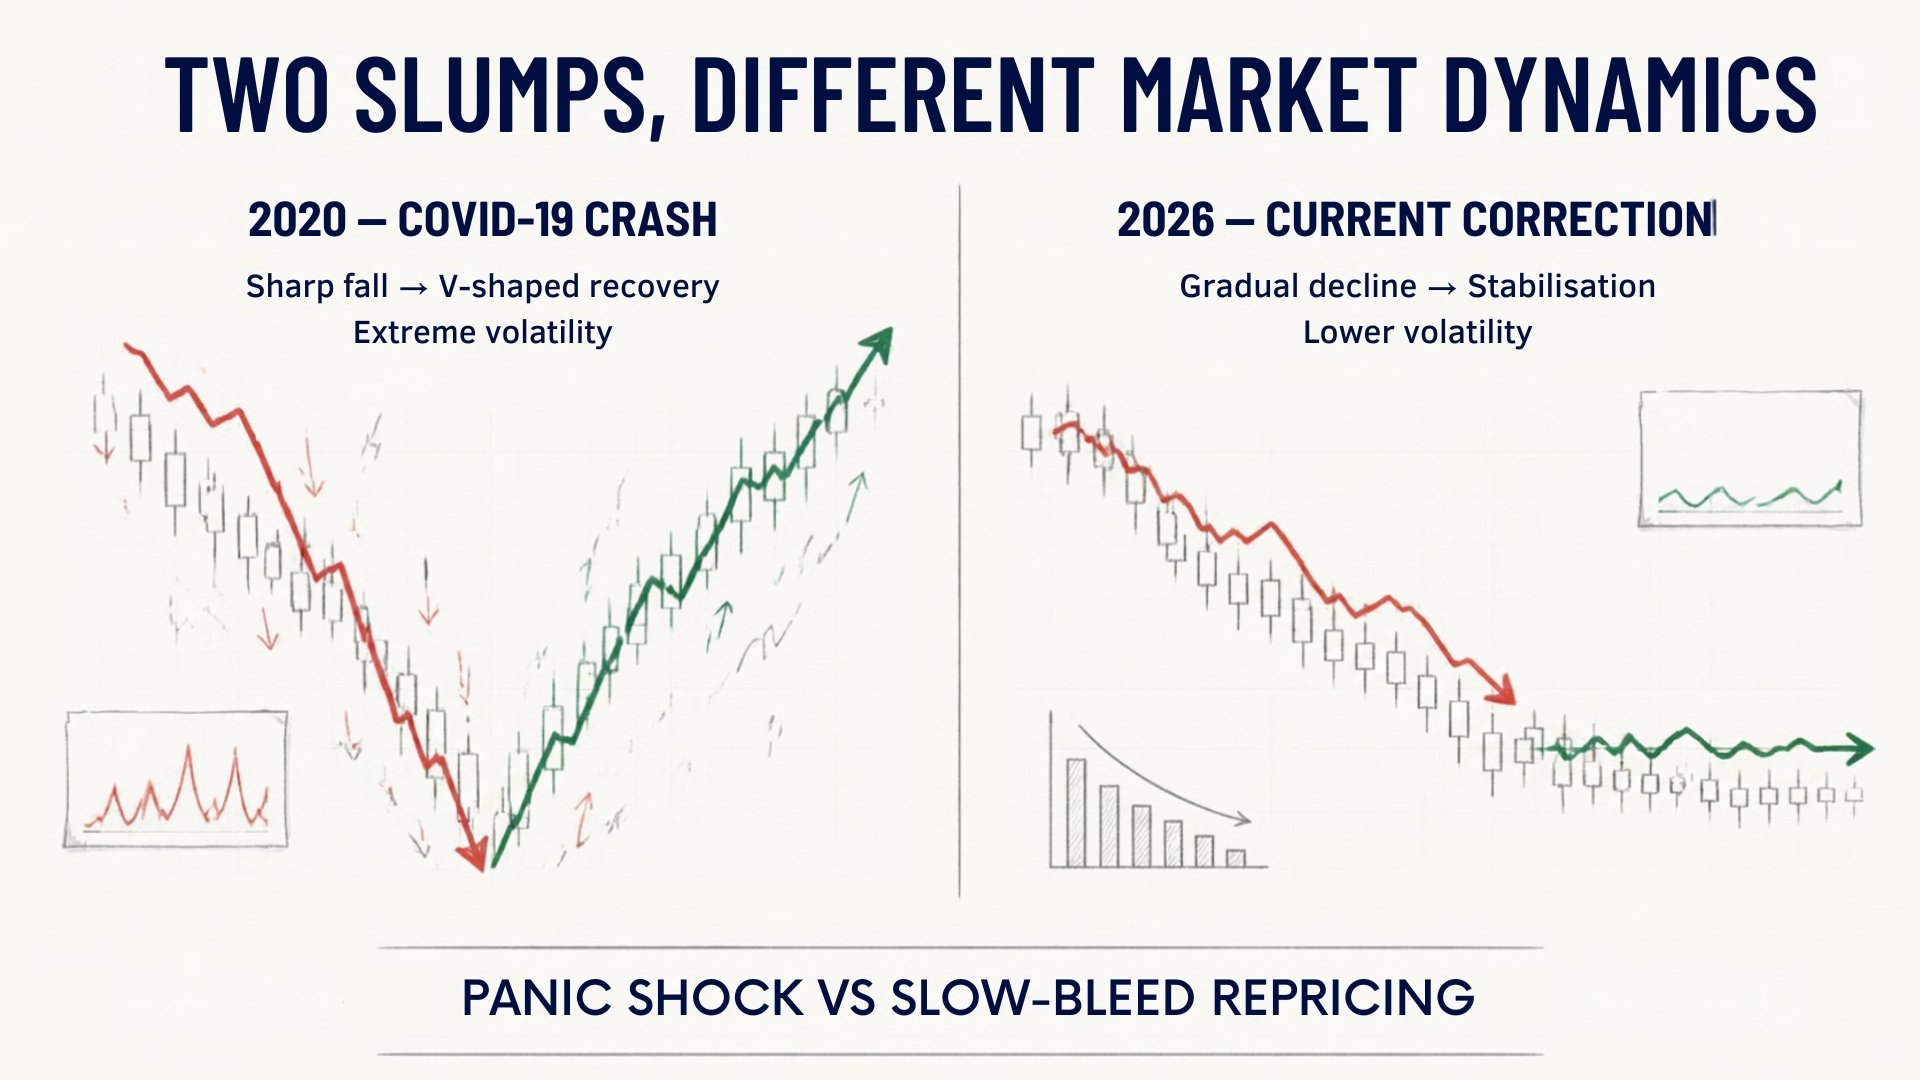
The 2020 fall was a black swan event. Stocks were sold off indiscriminately as global credit markets froze. The current slump is a "slow-bleed" re-pricing. India's market cap was trading at elevated historical valuations, leaving it exposed to global yield pressures and earnings fatigue.
The "Collateral Damage" Dynamic (Reading Between the Lines):
In 2020, EMs fell together in a liquidity surge. Today, India is acting as an EM yield donor. With US 10-year Treasury yields hovering near multi-year highs, institutional capital is departing non-US risk assets. Foreign Portfolio Investors (FPIs) are reallocating away from high-valuation growth markets to lock in higher risk-free dollar yields.
Domestic Micro-Shocks:
Beyond global macro headwinds, specific domestic triggers have weighed on broad sentiment:
Insurance Sector Regulatory Impact: Proposed shifts in commission structures and distribution rules caused steep drops in online aggregators (e.g., PB Fintech shedding ~33% in market value) and large insurance heavies (HDFC Life, SBI Life).
Tata Group Governance Developments: Headwinds across major Tata conglomerates resulted in an aggregate market-cap loss exceeding ₹40,000 crore, compounding index drag.
Reasons for the 2020 Market Crash
Global COVID-19 Pandemic: Lockdowns worldwide caused a sudden, historic halt to global supply chains, travel, and economic activity.
Unusual Uncertainty: A total lack of visibility regarding vaccine timelines, healthcare capacities, and virus severity triggered widespread panic selling.
Oil Price War: Saudi Arabia and Russia engaged in a price war in early 2020, causing crude oil futures to plunge into negative territory for the first time in history.
Extreme Liquidity Crunch: Investors scrambled to raise cash, triggering a systemic flight to liquidity across equities, corporate debt, and commodities.
Reasons for the Latest Market Crash (2026)
Geopolitical Conflict & Crude Oil Spike: Intensifying Middle East tensions (notably US-Iran conflict developments) pushed Brent crude prices past $105–$107/barrel, sparking severe inflation and trade balance concerns for import-heavy economies.
Soaring Global Bond Yields: US 10-year Treasury yields surged past 5.1% to multi-year highs, drawing capital out of riskier equities and into higher-yielding debt markets.
Aggressive Foreign Institutional Selling (FII Outflows): Continuous FII capital outflows pushed key indices down as foreign funds exited emerging market equities in favour of the US dollar and bonds.
Valuation Adjustments & Sectoral Pressure: Stretched market valuations faced a sharp reset, particularly in heavyweight sectors like banking, financial services, and insurance.
Currency Weakness: Local currency depreciation (with the Indian Rupee breaching historical lows past ₹96/USD) amplified import costs and accelerated capital flight.
2. Anatomy of the 2020 V-Shaped Recovery
To understand what it takes to reverse a 7-week slide, it is important to understand the specific drivers that fuelled the post-crash rally in COVID-2020:
The Global Central Bank "Bazooka": The US Federal Reserve slashed interest rates to near-zero and introduced unlimited Quantitative Easing (QE). This liquidity flood entered global financial markets, pushing investors toward emerging market equities in search of yields.
The Rise of Domestic Retail SIPs: Lockdowns accelerated retail market participation in India. Systematic Investment Plan (SIP) inflows grew consistently, creating a structural liquidity floor that absorbed substantial foreign selling.
Aggressive Corporate Cost-Cutting: Forced digitalisation allowed companies to trim operating expenses, yielding massive operating leverage once economic activity normalised.
3. What Will It Take for Nifty to Rebound Today?
Unlike 2020, there is no immediate prospect of central bank quantitative easing or near-zero global interest rates. Reversing the current 7-week slide requires structural alignment across both fundamental and technical factors.
Fundamental Requirements
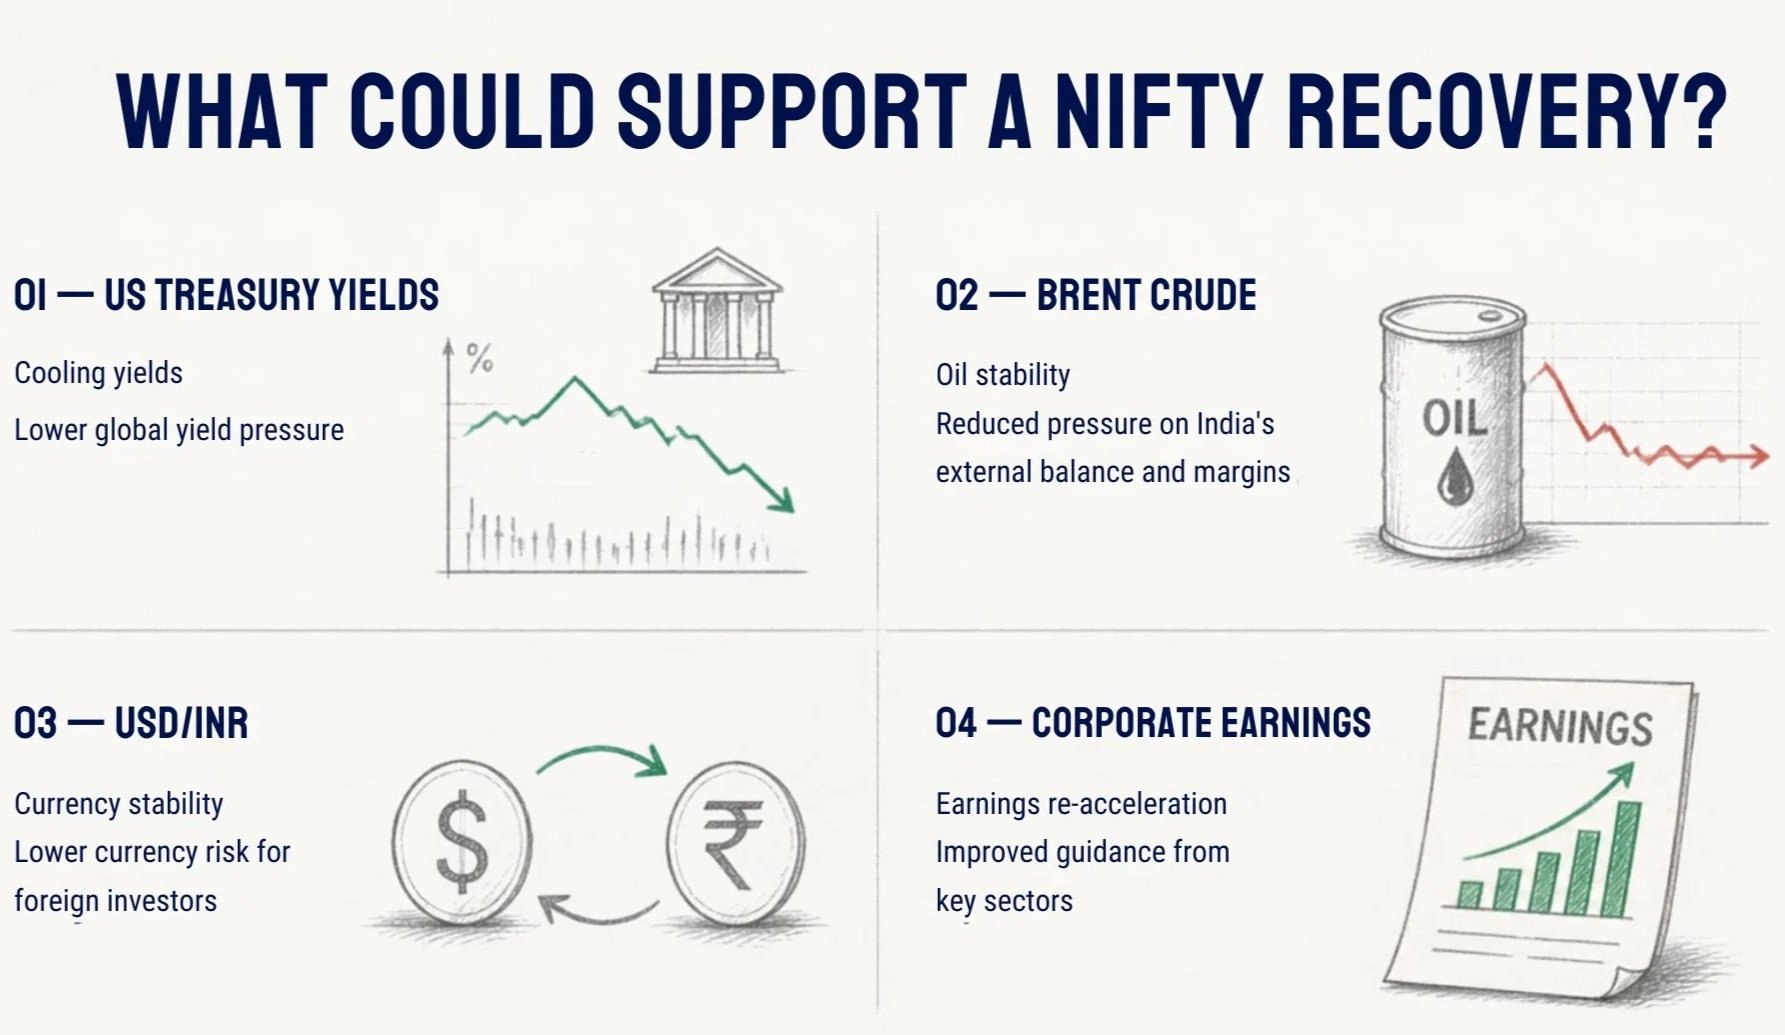
Cooling US Treasury Yields: FII selling is unlikely to abate until US yields pull back significantly. As long as risk-free dollar paper offers attractive yields, emerging market equities face capital headwind pressure.
Brent Crude Stability: Elevated crude oil prices (recently surging above $100/bbl due to geopolitical tensions) strain India’s current account deficit and limit the space for domestic monetary easing. Stabilising oil prices is essential to protect profit margins across the consumer and automotive sectors.
Currency Stabilisation (USD/INR): Pressure on the Indian Rupee increases currency risk for foreign investors. Currency stability is a key prerequisite for sustained foreign institutional inflows.
Earnings Re-acceleration in Key Heavies: Earnings growth must rise to support current valuation multiples. Heavyweights in Banking/Financials and IT need to report stable guidance to rebuild investor confidence.
Technical Roadmap & Key Levels
Crucial Support Zones: The 22285-22180 zone serves as the primary technical floor. A sustained breakdown below 22,800 (which occurred today, on 29th Sept.) would open the door toward the 200-day exponential moving average (EMA) retest near 22,383 as an immediate support. Holding 23,000 is necessary to establish a base.
Momentum Indicators & Divergence:
With daily momentum indicators hovering near oversold territory, traders are watching for a Bullish RSI Divergence—where the index prints lower lows while the RSI makes higher lows. This pattern often signals seller exhaustion before a structural bounce.
Moving Average Reclaims:
For a confirmed technical reversal, Nifty must clear two resistance hurdles:
Immediate Resistance: The 23,300–23,350 band, followed by the broader 23,500–23,600 supply zone.
Trend Confirmation: A strong weekly close above the 20-week EMA (~23,383), after rejection and a bounce off the EMA, gives an early signal to confirm the end of the weekly correction cycle.
Key Takeaway
The 2020 crash was driven by extreme liquidity fear, which was met with global monetary easing. The current slump reflects a valuation adjustment under higher global interest rates.
A V-shaped recovery is less probable in the current macro regime. Instead, the market is more likely to undergo a period of base-building within the 22,285–22,180 support range, setting the foundation for a gradual, earnings-driven recovery once global yields stabilise.